Over the past two and a half decades, EO has published more than 18,000 image-driven stories. This video highlights some of our favorites.
Image of the Day Atmosphere Land Water Human Presence Snow and Ice Videos
Exacerbated by El Niño, heavy rains in spring 2024 caused severe flooding in Tanzania’s Rufiji district, among other areas in eastern Africa.
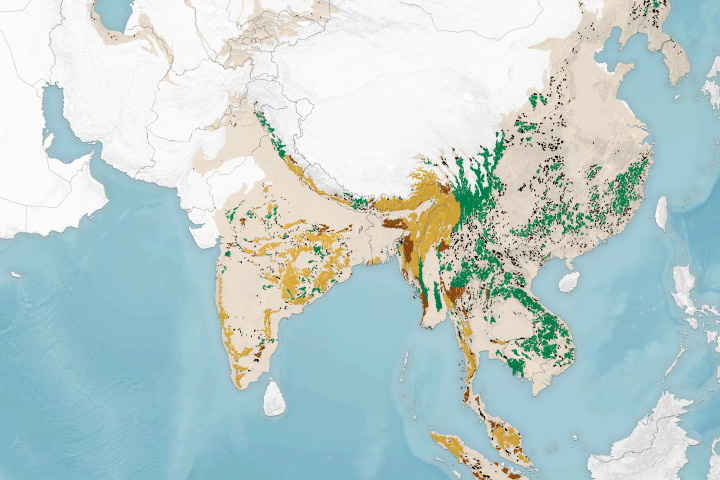
NASA satellites are helping track tiger habitat, offering hope and new insights for conservation as these predators face the consequences of rapid habitat loss.
Published May 3, 2024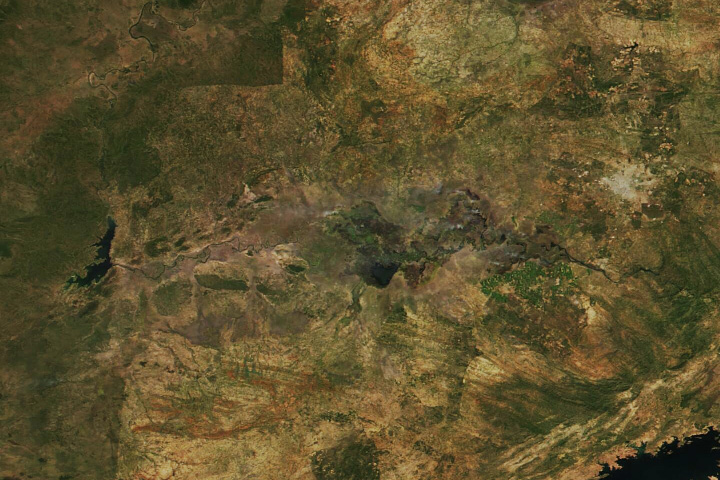
Severe drought in Zambia jeopardizes electricity supplies and food security for millions of people.
Published Apr 30, 2024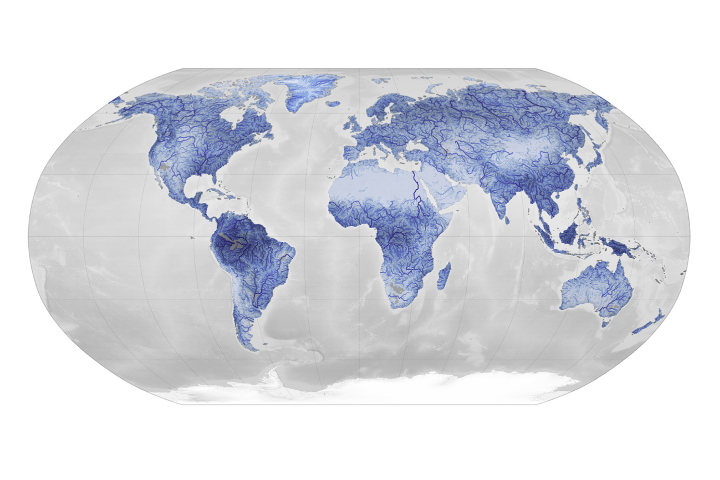
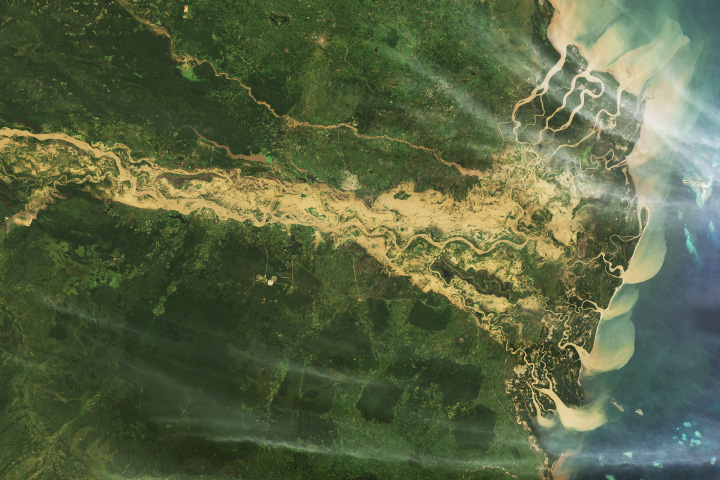
A novel approach to estimating river water storage and discharge also identifies regions marked by ‘fingerprints’ of intense water use.
Published Apr 30, 2024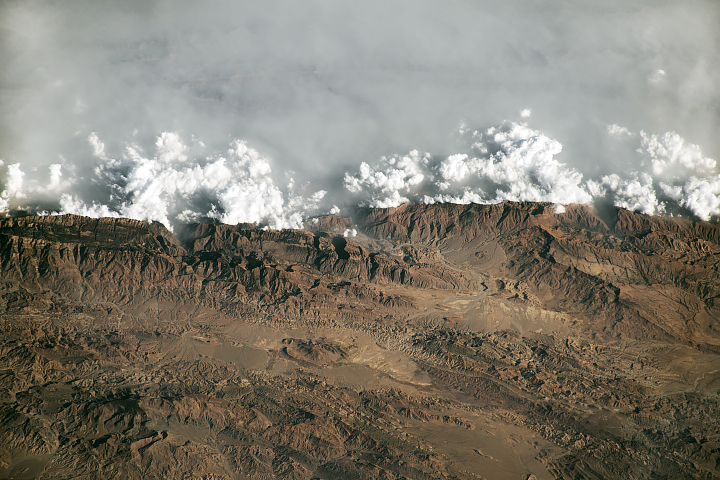
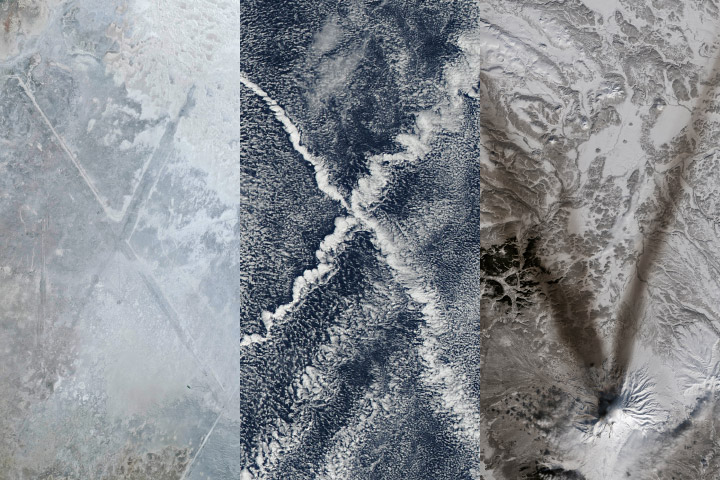
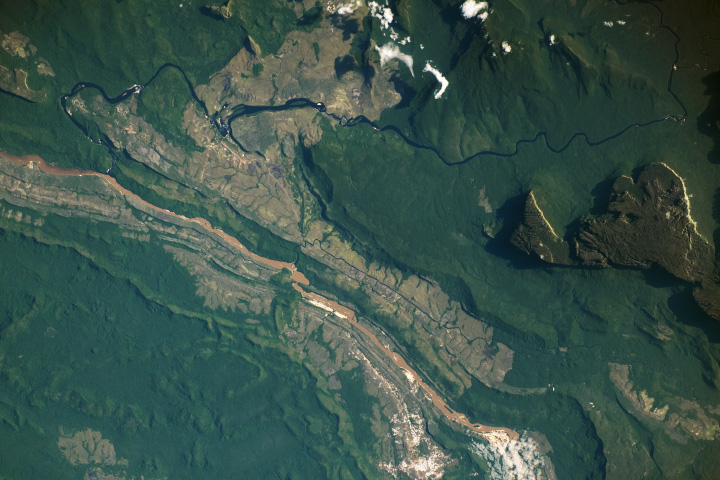
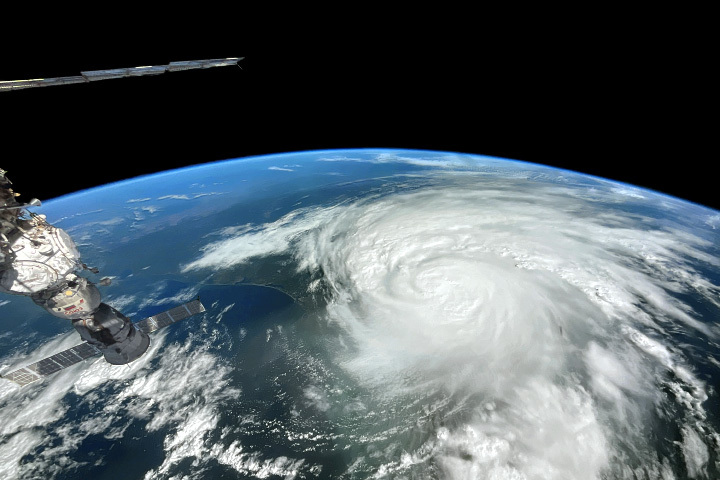
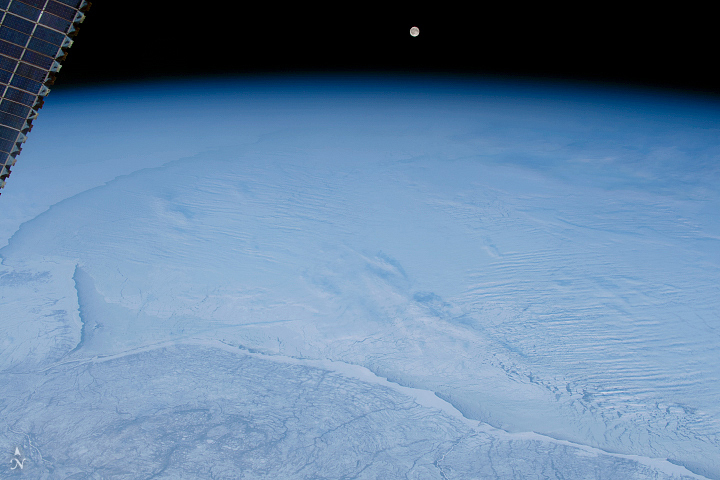
Clouds and haze crash into high-elevation ridges in this oblique photograph, taken by an astronaut on the International Space Station.
Published Apr 28, 2024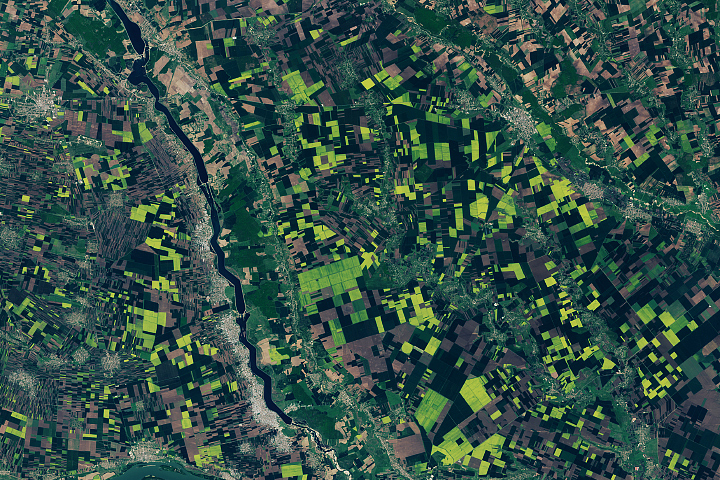
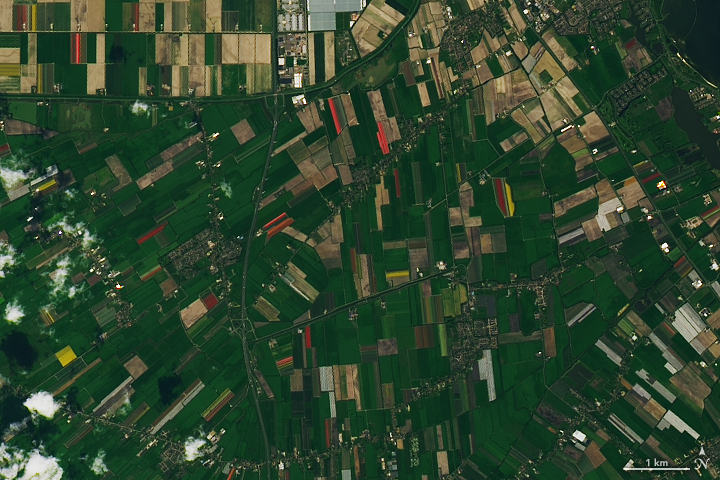
Agricultural plots are carpeted in yellow when rapeseed or canola plants bloom.
Published Apr 27, 2024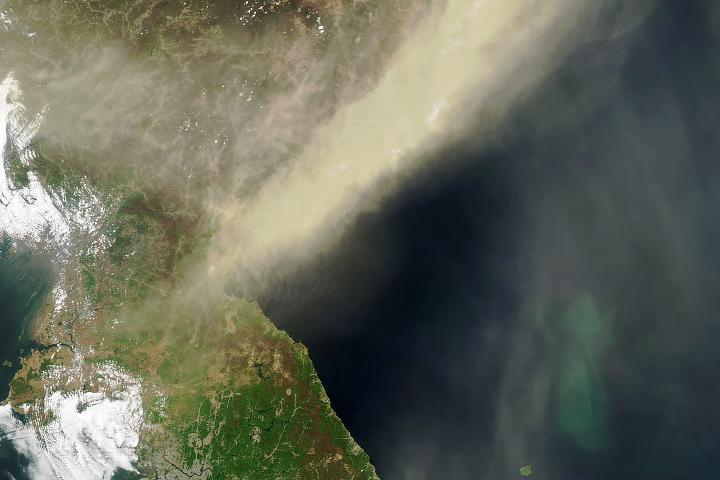
Every spring, satellites observe thick plumes of dust streaming from the Gobi Desert over East Asia.
Published Apr 25, 2024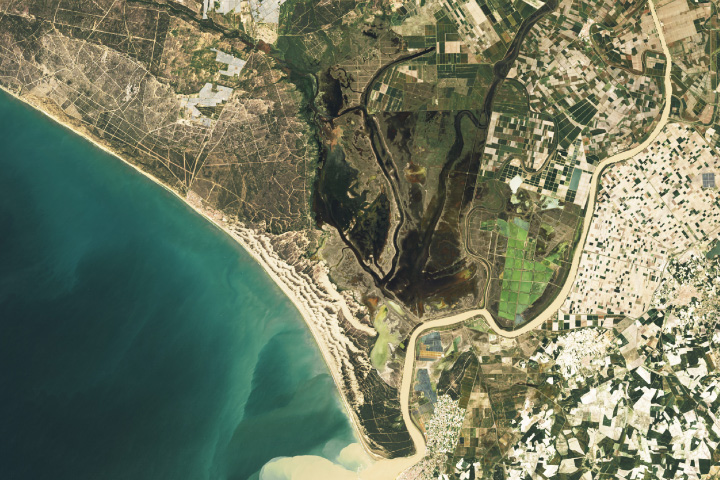
Amid prolonged drought, wet spring weather flooded marshes and greened vegetation in southern Spain.
Published Apr 25, 2024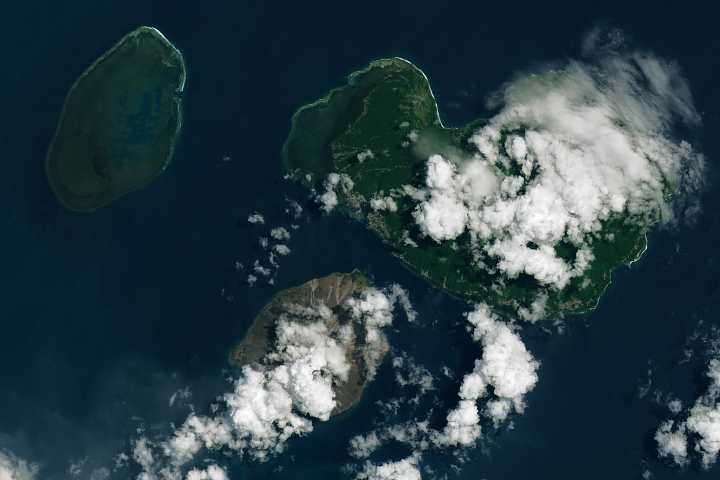
The powerful eruption lofted ash high into the atmosphere and spread tephra and other volcanic debris across the small island in Indonesia.
Published Apr 23, 2024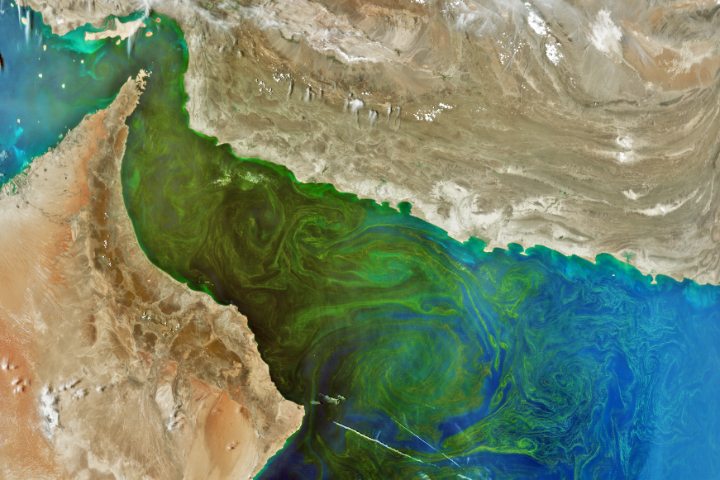
Your challenge is to tell us the location of the satellite image and why it is interesting.
Published Apr 23, 2024
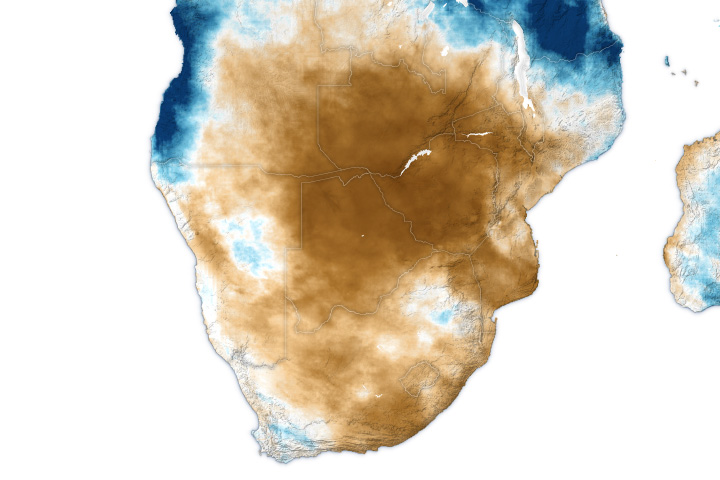
One of the driest growing seasons in decades has decimated crops and left millions hungry.
Published Apr 22, 2024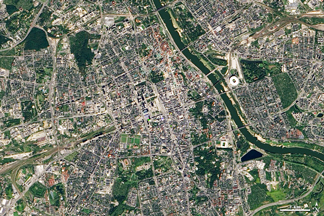
What do you do when presented with a new satellite image? Here's what the Earth Observatory team does to understand the view.
Published Nov 18, 2013Have you ever wondered what it would be like to live in a different part of the world? What would the weather be like? What kinds of animals would you see? Which plants live there? By investigating these questions, you are learning about biomes.
Published Aug 28, 2020
These maps depict anomalies in land surface temperatures (LSTs); that is, how much hotter or cooler a region was compared to the long-term average. LST anomalies can indicate heat waves or cold spells.
In the country’s southeast, towering table-top mountains known as tepuis host unique species of flora and fauna.
Published Apr 21, 2024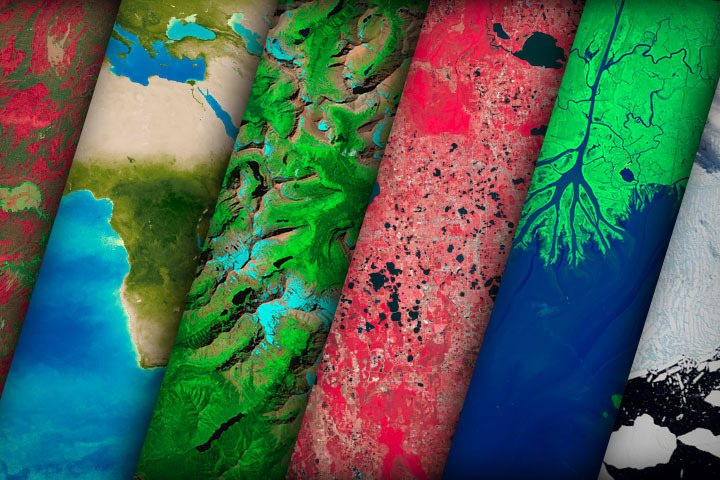
NASA satellites document how our world—forests, oceans, human landscapes, even the Sun—changes over months, seasons, and years.
Published Apr 29, 2009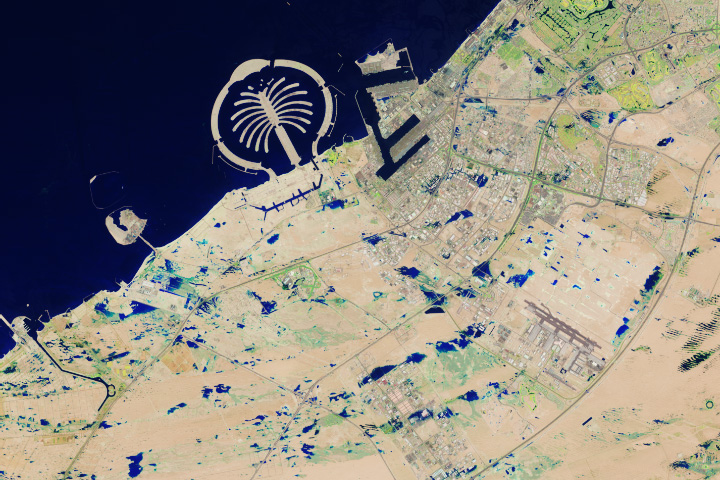
A powerful storm system battered major cities in the Arabian Peninsula.
Published Apr 19, 2024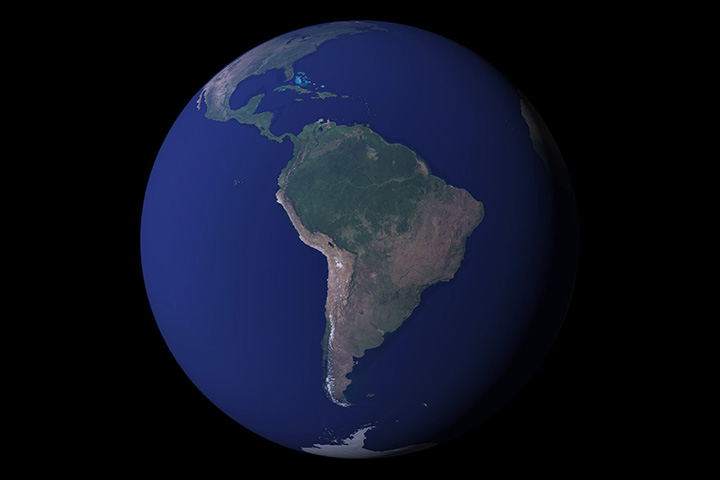
12 months of high-resolution global true color satellite imagery.
Published Oct 13, 2005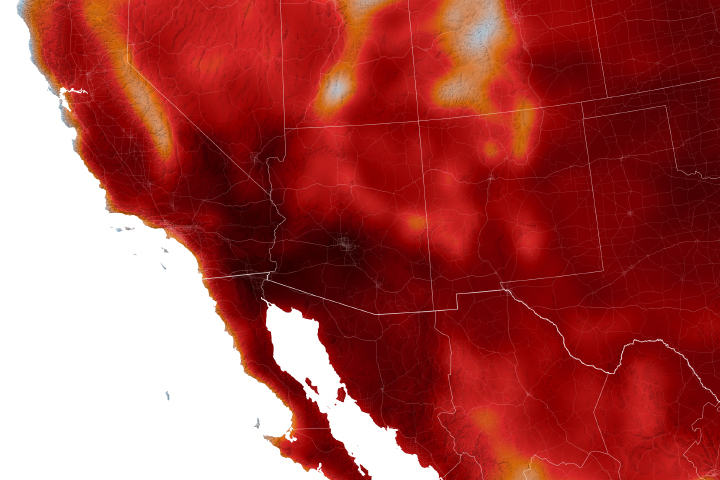
Warmer-than-average temperatures are showing up locally and globally, with consequences for people, landscapes, and ecosystems.
Published Aug 15, 2023
These maps show the average amount of water vapor in a column of atmosphere by month. Water vapor is the key precursor for rain and snow and one of the most important greenhouse gases in the atmosphere.

Snow and ice influence climate by reflecting sunlight back into space. When it melts, snow is a source of water for drinking and vegetation; too much snowmelt can lead to floods. These maps show average snow cover by month.

When fuels such as coal, wood, and oil burn incompletely, they produce carbon monoxide. The gas is spread by winds and circulation. These maps show monthly averages of CO in the lower atmosphere.
The 2023 season runs from June 1 to November 30, with peak activity generally occurring in September.
Published Jun 1, 2023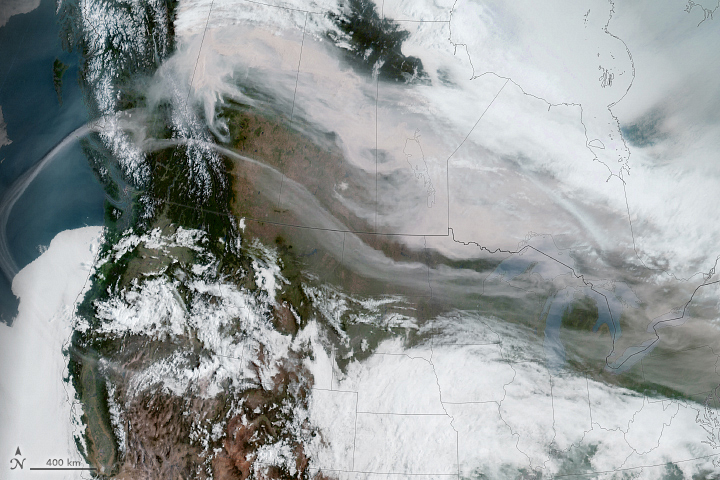
Wildland fires in 2023 brought hazy skies and poor air quality to several countries north of the equator.
Published May 22, 2023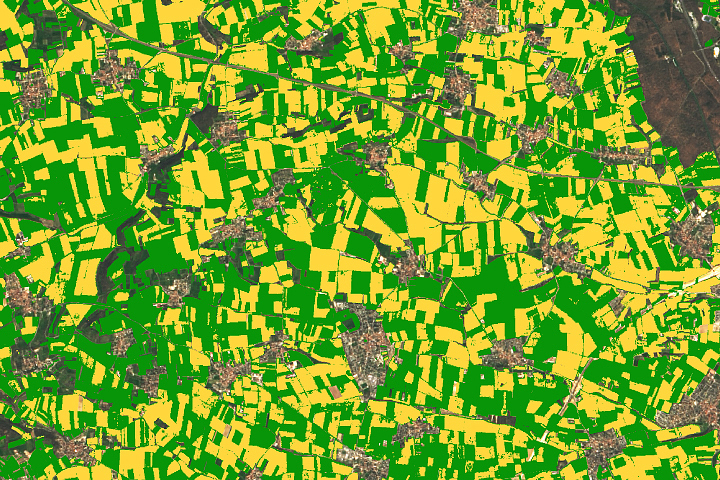
From soil conditions to crop productivity, satellite data help inform farmers, scientists, and decision-makers in the U.S. and around the world.
Published Feb 28, 2023
These maps depict monthly total rainfall around the world. Rainfall is the primary source of fresh water for humans, plants, and animals. Rain also moves heat between the atmosphere, oceans, and land.

Land surface temperatures rise and fall with the heat of the Sun, and they represent how hot or cold the surface would feel to touch. These maps show daytime land temperatures as measured from space.
Over the years, astronauts aboard the orbiting laboratory have snapped spectacular photographs of Earth’s snow and ice in both hemispheres.
Published Dec 21, 2022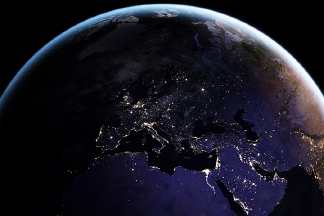
Satellite images of Earth at night have been a curiosity for the public and a tool of fundamental research for at least 25 years. They have provided a broad, beautiful picture, showing how humans have shaped the planet and lit up the darkness.
Published Apr 12, 2017
In honor of our site anniversary, we offer a selection of some of the most beautiful, newsworthy, interesting, and scientifically important images from 23 years online — one image for each day of the calendar year.
Published Apr 26, 2022